Just how accurate is Alexa? We compare Google Analytics to Amazon’s ‘Web Information Company’
Alexa vs Reality
I’d always wondered how closely Alexa’s traffic graphs mirror reality. In a recent article on how the Sun’s traffic was diving uncontrollably, I used an Alexa comparison graph to illustrate my point but I’d never really put the time in to measure its statistics. I think it’s about time that I did.
Slapdash Methodology
My methodology was to use two high traffic sites so that the margin of error would be smaller. Pretty basic stuff. I’m sure someone with more high traffic sites and more time could do a better comparison, but I couldn’t see anything out there.
Site Number 1

So I took a screengrab of the last 2 years’ GA.
Then I got the same site’s graph from Alexa.

Then I stretched the Alexa graph to make sure the legends matched up.

And tweaked with the colours, removed Alexa watermark and away we go

Then I made some final compensations for baseline disparity to get something that looks like this…
The Results of Site 1

I was a little surprised with this, because the results are much more accurate than I would have imagined. In April through to January, most spikes are faithfully reproduced in Alexa.
Spike A is perfect, but its size is the same on the Alexa graph as future traffic in September 2013, whereas according to GA, we don’t hit traffic like this until Ocbober/November 2013.
Spike B is matched again, but this time the GA spike towers over the Alexa graph and again with spike C, although the dip and subsequent spike is matched perfectly. This happens once more with spike D.
What Does This Mean?
Broadly speaking, traffic peaks and troughs seem to match pretty well. The only discrepancy is the scale of the graph. With Alexa, the traffic increases are, in general, disproportionate. But we should expect this, as Alexa’s metrics are not traffic related, but ‘reach’ related.
The analytics from Alexa is gathered from ‘thousands’ of plugins. A site’s metrics are based on how your site compares to all the others.
The Alexa Traffic Rank of a given website isn’t determined solely by the traffic to that site, but takes into account the traffic to all sites and ranks sites relative to each other. Since your site is ranked relative to other sites, changes in traffic to other sites affect your site’s rank.
So, if your traffic goes up by 10%, but all the sites above you increase theirs by 20%, Alexa will show a drop in traffic on their graphs.
How about site 2?
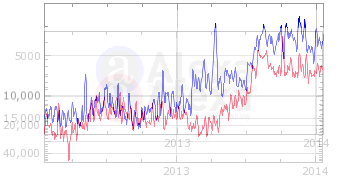
Results for 2 mostly mimicked site 1: peaks and troughs mainly mirrored, but the overall scale of the graph looked a little off. So, I decided to overlay the 2 site’s Alexa graphs and their 2 GA graphs. This, I’m afraid was harder to do than it sounds.
Whilst site 1 and site 2 have similar traffic levels, the spikes in site 1 throw the scales out a bit. Whilst this was easy to compensate for with GA, with Alexa it was tricky. Alexa graphs use a logarithmic axis to denote reach, and when I scale the image in Photoshop it does this by default in a linear fashion. I would have had to distort the image to get it to play ball and match up the lines, and perhaps I shall one day, but for now, we’ll have to live with a graph whose axes are slightly out.


As you can see, blue (site 1) is regularly above red (site 2) and the period from January-June is shown as a big disparity between the sites. The period from August to December is shown on Alexa as a big increase for blue, but in reality the blue site on trounces the red in real life by mammoth spikes in traffic.
Conclusion
1. Alexa will show which site is ahead of another one, but don’t expect the differences to be as marked as they are in the graph
2. Alexa will show most peaks and troughs of all sites.
3. Alexa is not a proper analytics tool. Please use responsibly.
Filed under: Alexa,Analytics,Coding,Google Analytics,Other Stuff - @ January 22, 2014 4:09 pm

